INSTRACK
INSTRACK
Introduction
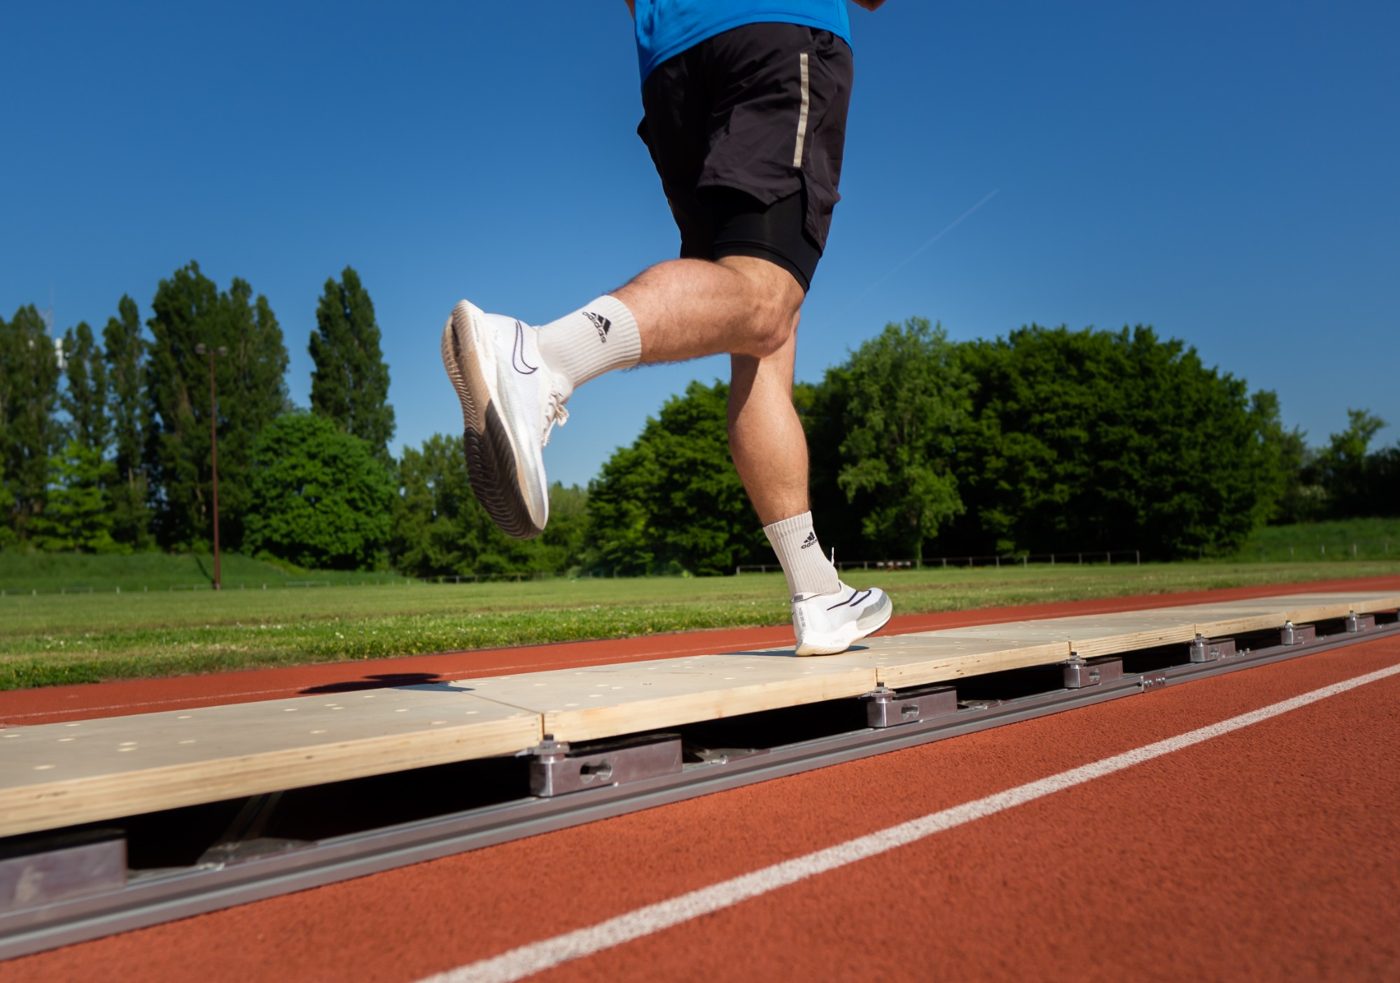
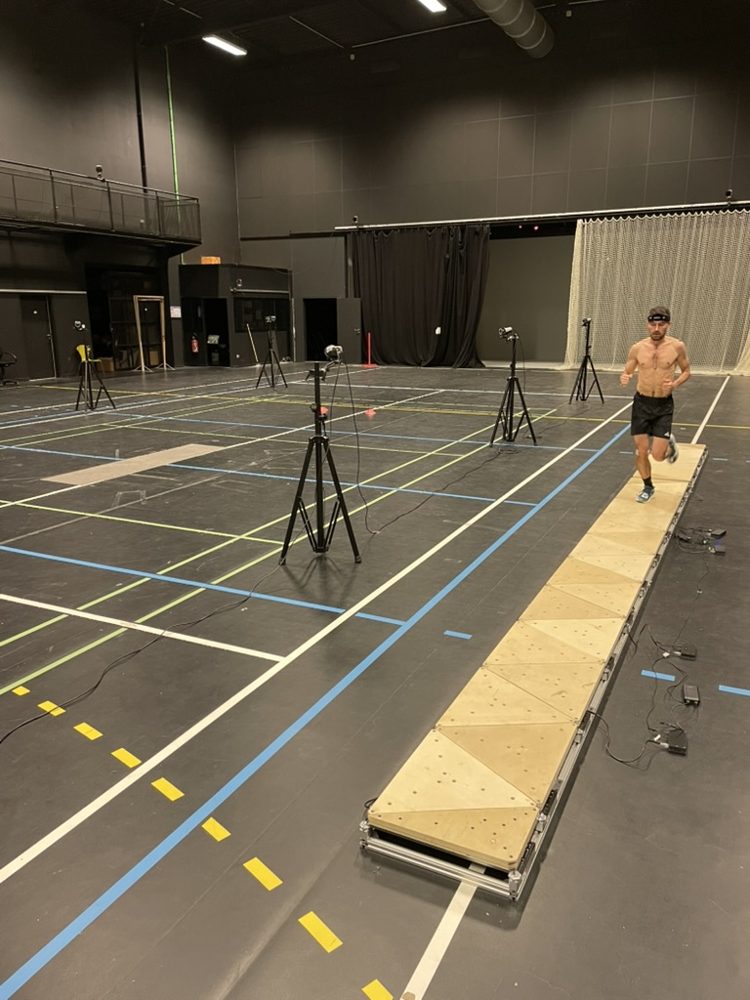
INSTRACK is a modular instrumented floor that measures vertical forces. Unlike a conventional force plate, limited to a fixed area, it is made of measuring tiles that fit together to suit your needs: add as many as necessary, in length as well as in width, on an athletics track, in a sports hall or in a laboratory. You can thus measure forces in real conditions, without constraining the athlete's movement.
Main features
| Feature | Value |
|---|---|
| Sensor type | Uniaxial (vertical) force sensors |
| Measurement range | 0 to 2000 N per sensor |
| Accuracy | Mean error of 1.27 N (0.3%), repeatability < 2 N |
| Sampling frequency | 1000 Hz |
| Length | Modular, adapted to your needs |
| Acquisition | Maxi-Phyling |
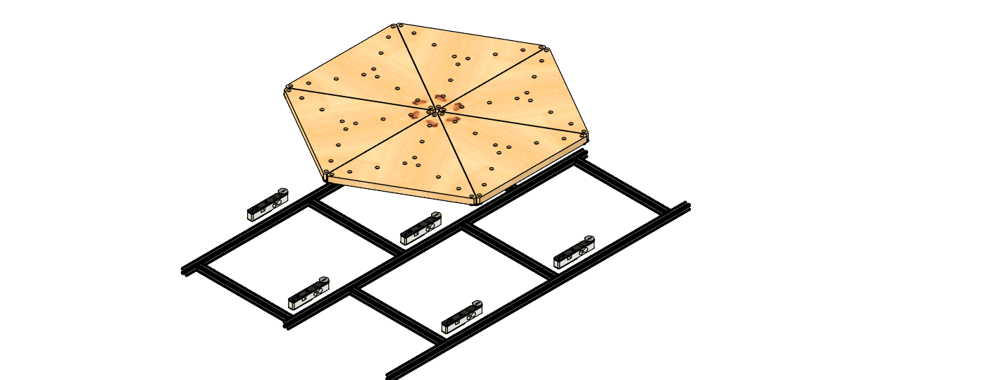
Each sensor can support 2 to 6 triangle vertices. This way, even if the foot lands across two triangles, the force is still measured: the total force is obtained by summing the forces of all sensors. The number of sensors and their layout can be adapted to the intended application (running, walking, other tasks).
Sensor and plate
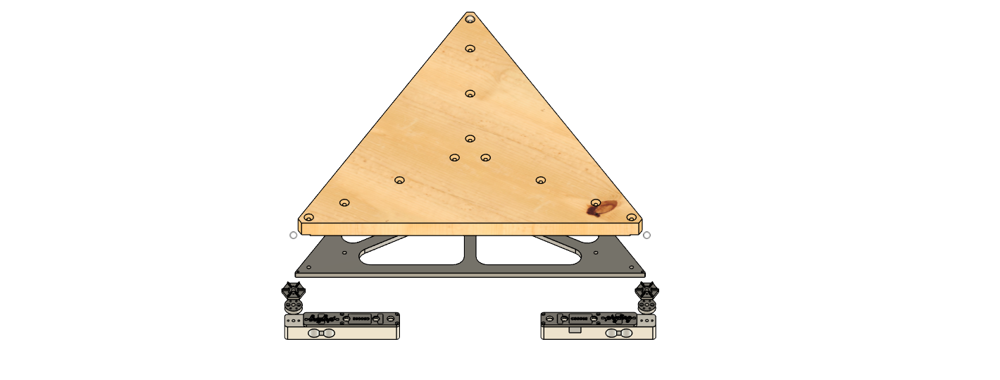
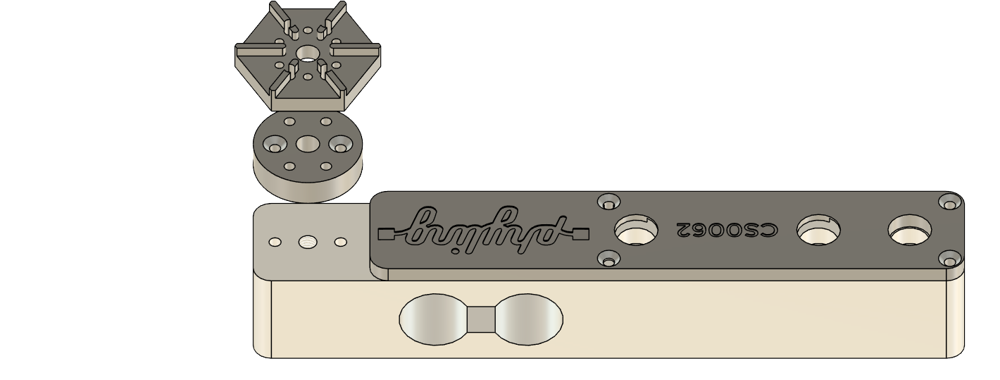
Each triangular plate rests on force sensors by its three tips. The tips fit into machined studs screwed onto the sensors.
User guide
I. Calibration
Sensor calibration is carried out by Phyling. Each sensor is calibrated on a calibration bench: static forces from 0 to 1500 N are applied to both the sensor and a reference sensor, and a linear regression gives the coefficient specific to each sensor (conversion of the signal into force).
II. Recording data
- Switch on the acquisition system and check that all sensors are connected.
- Start the recording from the Realtime tab of the Phyling application.
- Stop the recording. The data are sent directly to the Phyling application.
API
An API is available to redirect the data to other recording systems. See the Dev section: real time and webhooks.
III. Data processing
- Associate: In the Data tab, find the recordings associated with an athlete. Unassociated data from a recent recording can be accessed by clicking the NEW button (in blue). Click on a recording to associate it.
- View: Click on an associated recording to view the data, make selections and export the data in
csvformat.
Data
The forces measured by each sensor are zeroed and then summed to obtain the total vertical force applied to the track. Each step is then detected and assigned to the right or left foot, which makes it possible to compute many running technique indicators. The validity of the track was demonstrated in the scientific article A size-adjustable instrumented track to measure vertical ground reaction forces: a validation study (IEEE Sensors Journal, 2025): excellent agreement with a reference force plate (ICC > 0.98).
Athlete profile
| Indicator | Description | Unit |
|---|---|---|
| Speed | Running speed on the track | km/h |
| Cadence | Number of steps taken in 1 minute | steps/min |
| Contact time | Duration of a foot contact with the ground: the time needed to produce the energy that propels the runner forward | ms |
| Step length | Average distance from one foot contact to the next | cm |
| Vertical oscillation | Vertical displacement of the body over one stride | cm |
| Vertical ratio | Ratio between vertical oscillation and step length | % |
| Asymmetry | Difference in % between the force produced by the left foot and the right foot. A difference > 10% is a high risk of injury and/or a limit for performance | % |
Values per foot
| Indicator | Description | Unit |
|---|---|---|
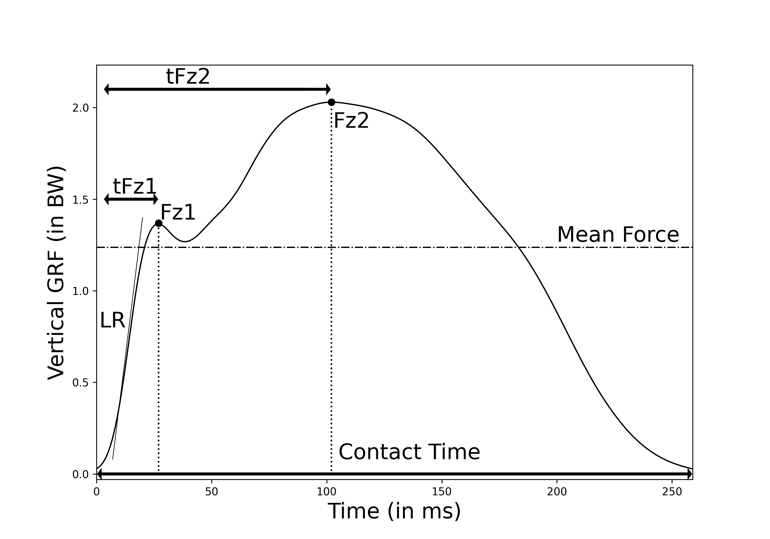
| Impact peak (Fz1) | First, "passive" force peak caused by the foot hitting the ground. It reflects the quality of foot placement (heel strike, stress on musculoskeletal structures) | N/kg |
| tFz1 | Time from initial contact to the impact peak | ms |
| Maximum force (Fz2) | Second force peak, during the propulsion phase | N/kg |
| tFz2 | Time from initial contact to the maximum force | ms |
| Loading rate (LR) | Maximum value of the force derivative during loading. The higher it is, the faster the force is applied and the more the tissues are loaded over a short time | N/s/kg |
| Mean force | Mean force over the step | N/kg |
| Impulse | Total amount of force produced over one step (Force × Contact time). It is the energy returned to the ground, which determines the following flight phase | N·s/kg |
| Contact time (CT) | Time from initial contact to toe-off | ms |
Centre of pressure (CoP) measurement
In addition to the vertical force, INSTRACK computes the centre of pressure (CoP): the point on the ground where the force is applied at each instant of the step. Tracking its movement shows how the foot rolls over the ground, from the heel to the forefoot. The CoP is also used as the point of application of the force to estimate joint loads (inverse dynamics), directly in the field.
Calculation
The position of each sensor on the track is known. The CoP is the average of the sensor positions, weighted by the force measured by each one: the more force a sensor receives, the closer the CoP is to it.
where and are the coordinates of sensor on the track and is the vertical force it measures.
Animation: the force is distributed over the sensors as the runner moves along, and the CoP (point of application) moves accordingly.
| Indicator | Description | Unit |
|---|---|---|
| COP_x | Centre of pressure position along the track (anteroposterior, AP) | mm |
| COP_y | Centre of pressure position across the track width (mediolateral, ML) | mm |
The accuracy of the CoP measured by INSTRACK was assessed against reference force plates: see the study Mesure du centre de pression à partir d'une piste instrumentée en course à pied : étude de la précision.
Anteroposterior force estimation
INSTRACK measures the vertical force. The anteroposterior force (braking then propulsion, along the running direction) can be estimated from it using a neural network trained on the vertical force alone. See the article Prediction of running anteroposterior ground reaction forces from the vertical component through a deep learning approach (PDF).
Biomechanical report
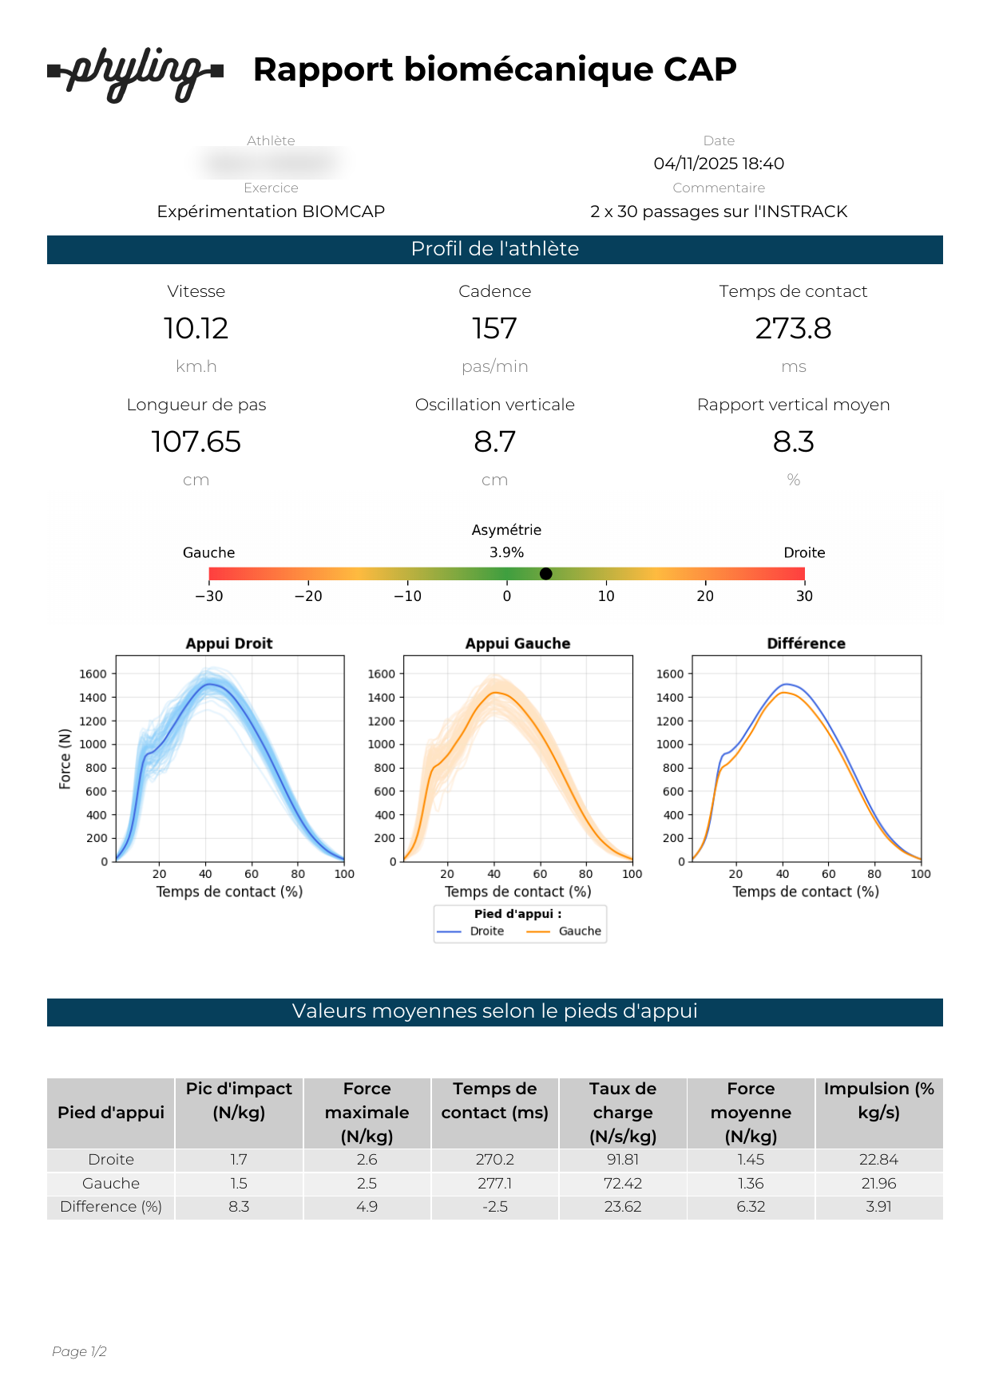
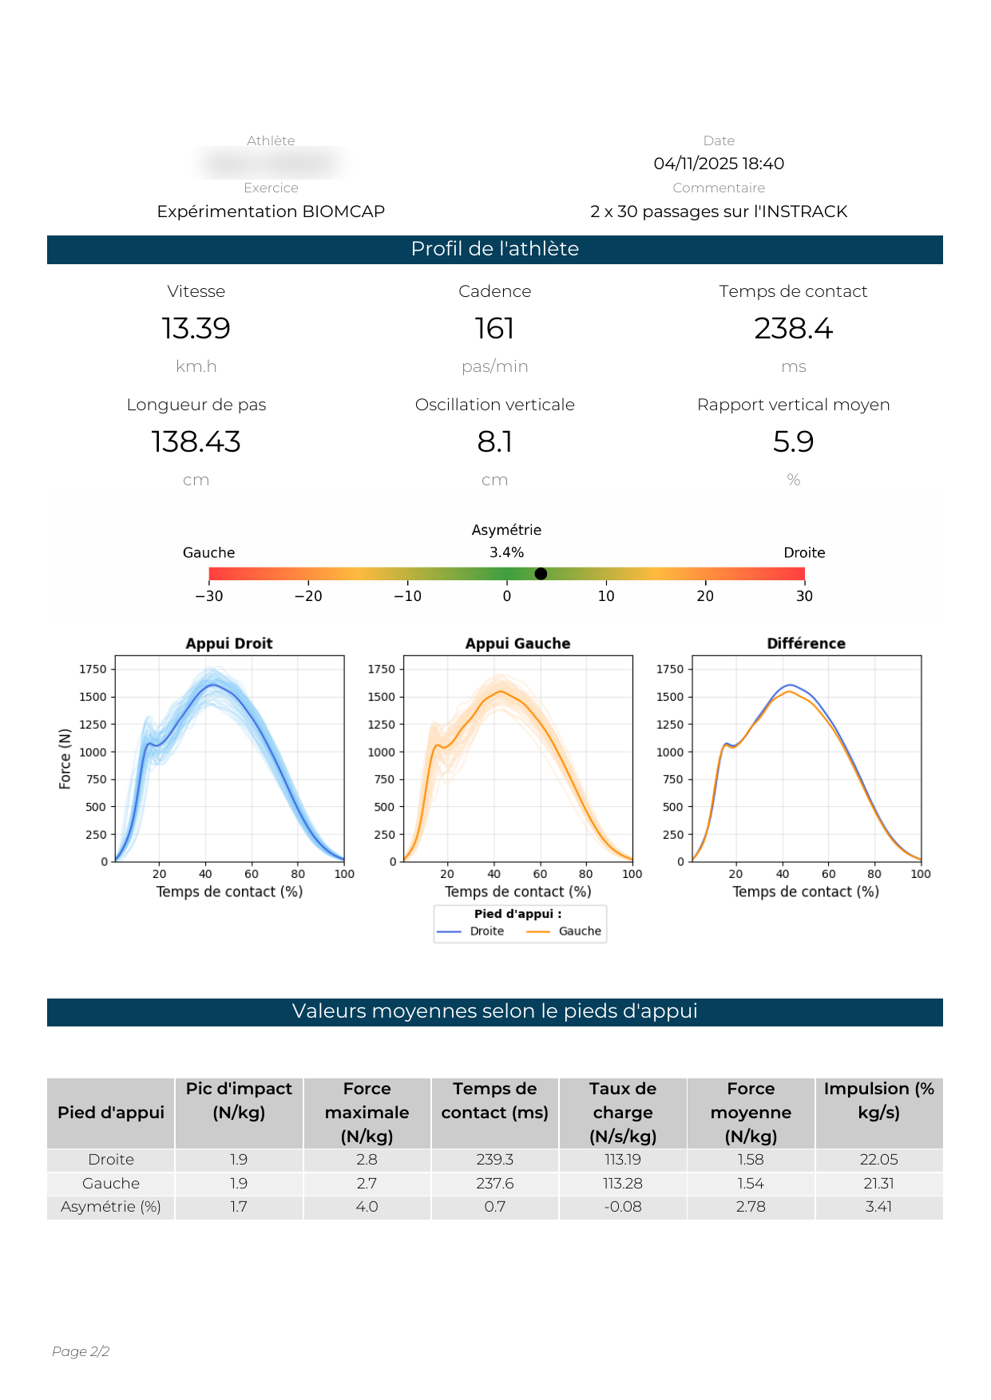
From the recordings, Phyling generates a running biomechanical report for each tested speed. It brings together the athlete profile, the right/left asymmetry, the force curves of each step (right foot in blue, left foot in orange; the thick line is the mean of all measured steps) and the table of mean values per foot.
[!NOTE] Running technique is not a universal model: it is the best compromise the body spontaneously finds between all these parameters. They vary with speed, type of shoe, sex, age, weight… and fatigue.
The report appendix defines each term, explains the effect of increasing or decreasing each parameter and gives comparison values (men and women, from 10 to 16 km/h).