PI3D
PI3D
Introduction
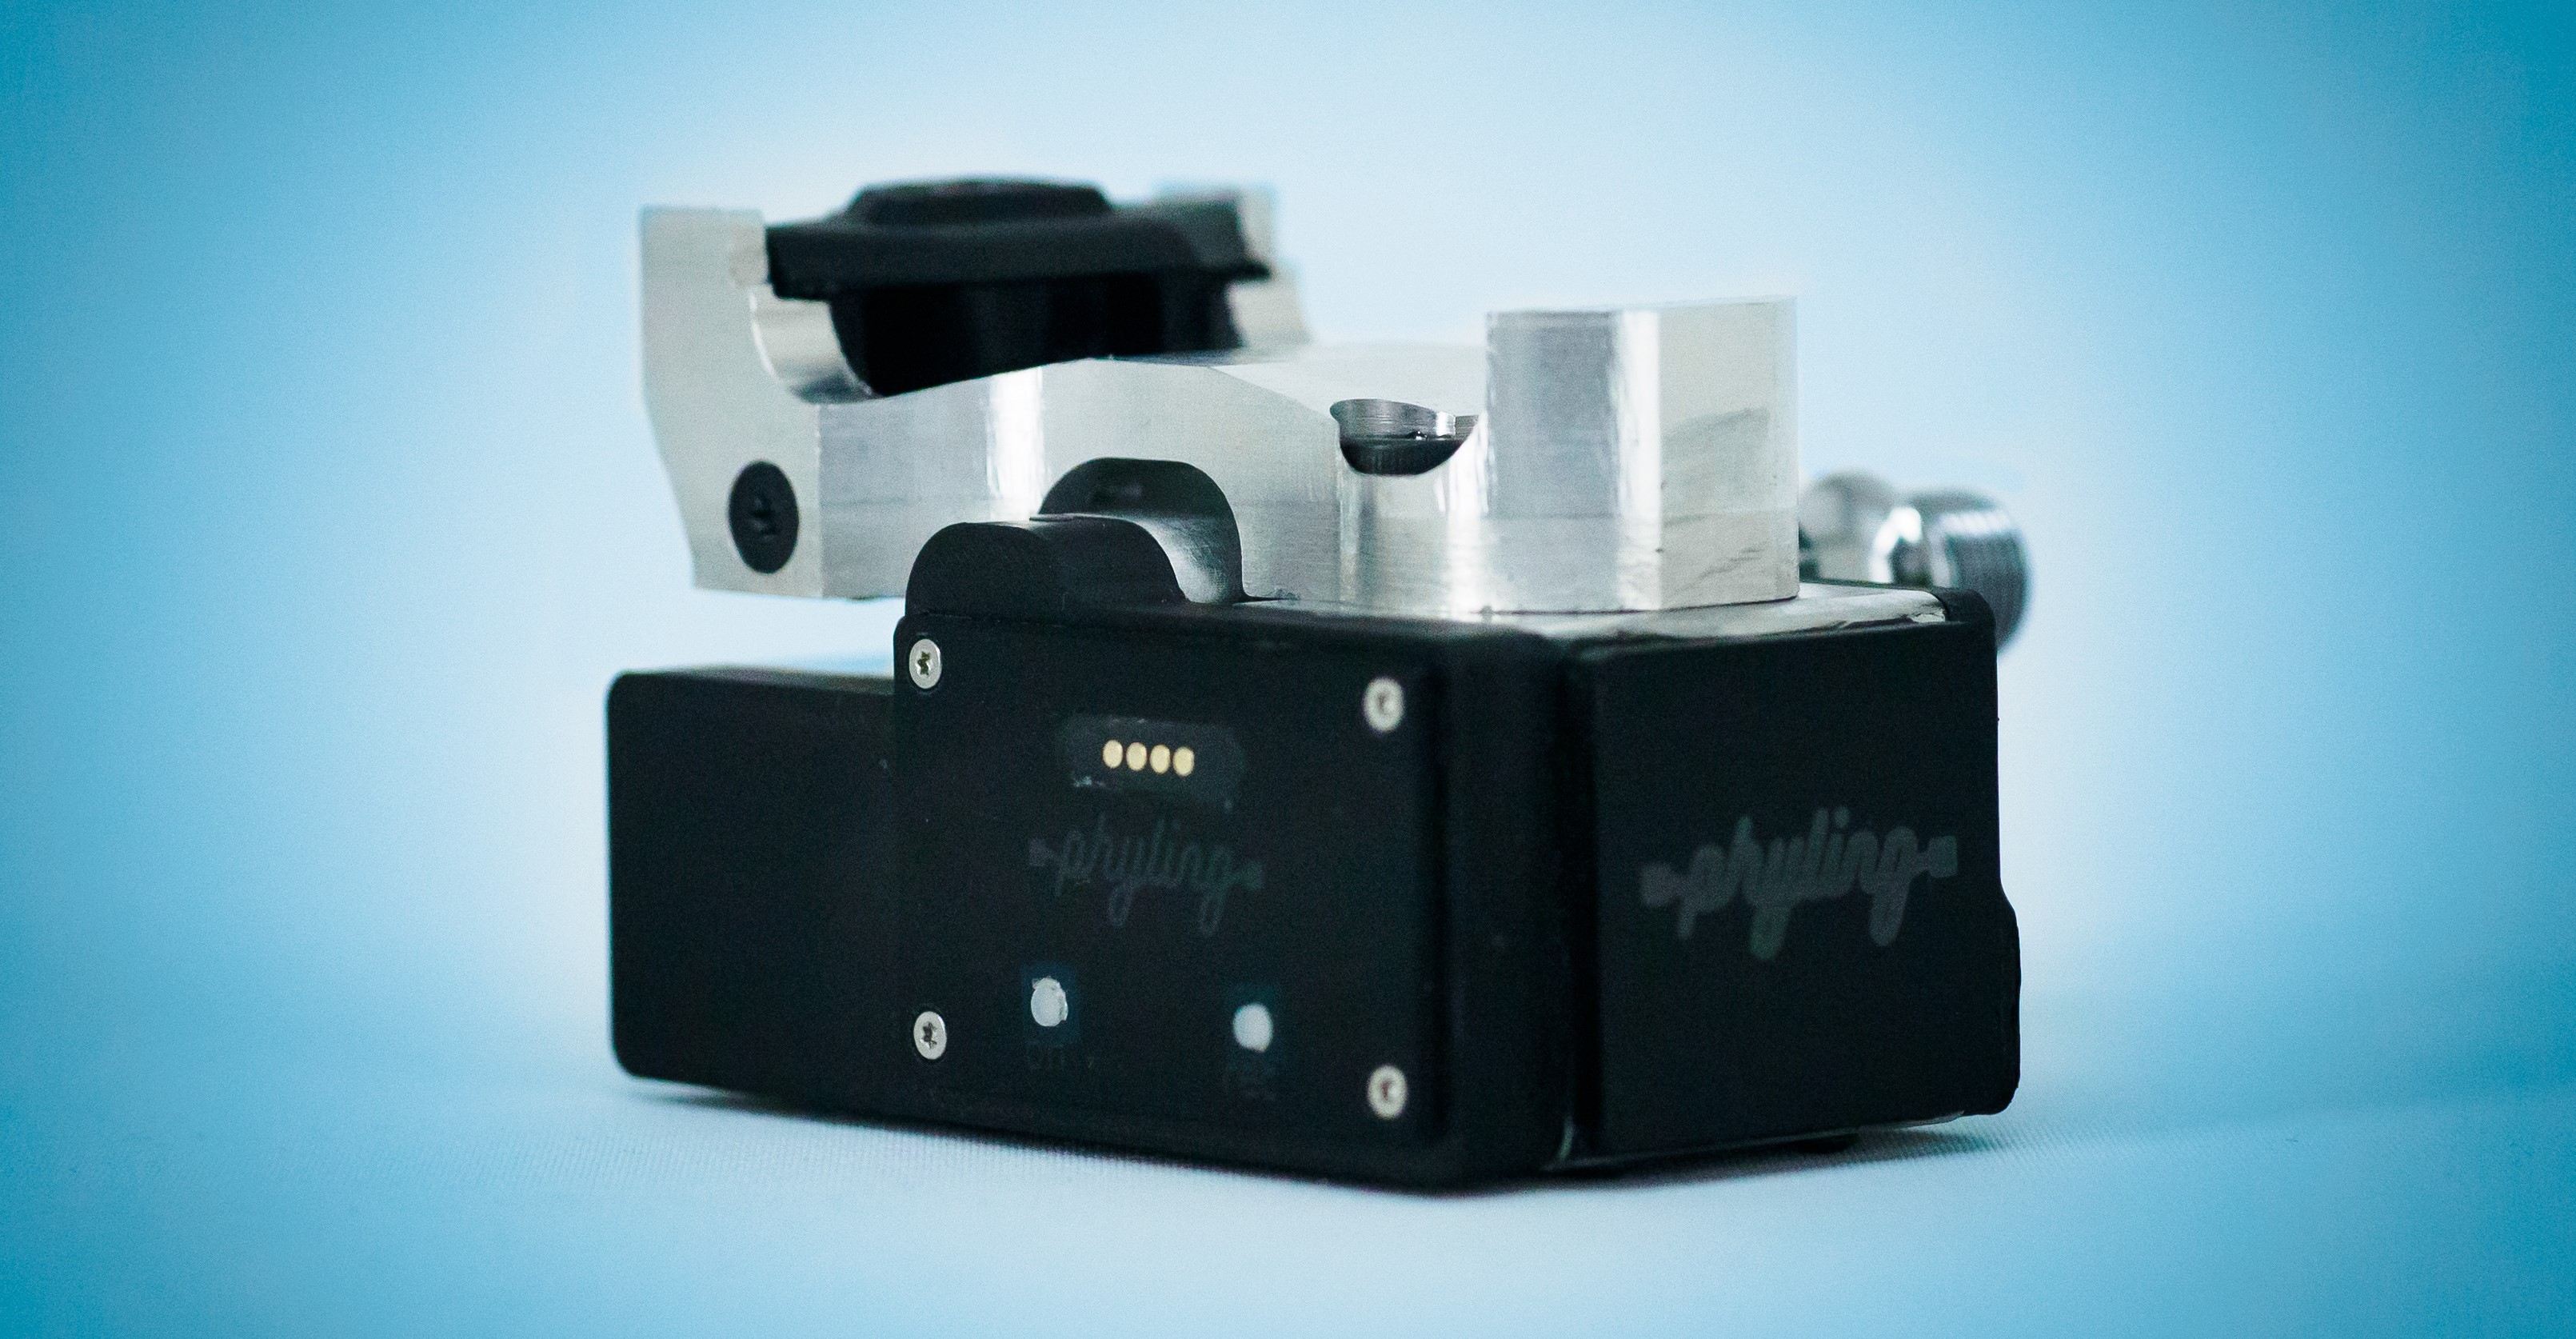
The PI3D (3-axis instrumented pedals) are a solution that integrates wireless sensors directly into bicycle pedals to assess the interaction forces between the feet and the pedals. These instrumented pedals accurately measure the forces applied in all three directions, the pedal angle and the pedaling cadence. These measurements enable a thorough and comprehensive analysis of pedaling technique, allowing the calculation of many indicators, including pedaling efficiency.
Main features
| Feature | Value |
|---|---|
| Sensor type | Triaxial strain gauge force sensor |
| Measurement range | -100 to +100kg for Fx and Fy, -450 to +450kg for Fz |
| Weight | 530g per pedal |
| Materials | Aluminum |
| Operating temperature range | 0° to +40 °C |
| Battery life | 2h |
| Data transfer | Bluetooth Low Energy (BLE) |
| Data synchronization | 5 ms over BLE if recording longer than 15 seconds |
| Compatibility | Flat cleats, Shimano and Look |
| Included accessories | Magnetic charger |
The PI3D have a standard thread and fit all types of cranks. Remember to apply grease to the thread before mounting. The Phyling application includes algorithms specially developed for the PI3D. They make the pedals easier to use by automatically processing the data to provide many relevant indicators. See the Data section to learn more about the calculated data.
SHIMANO pedal
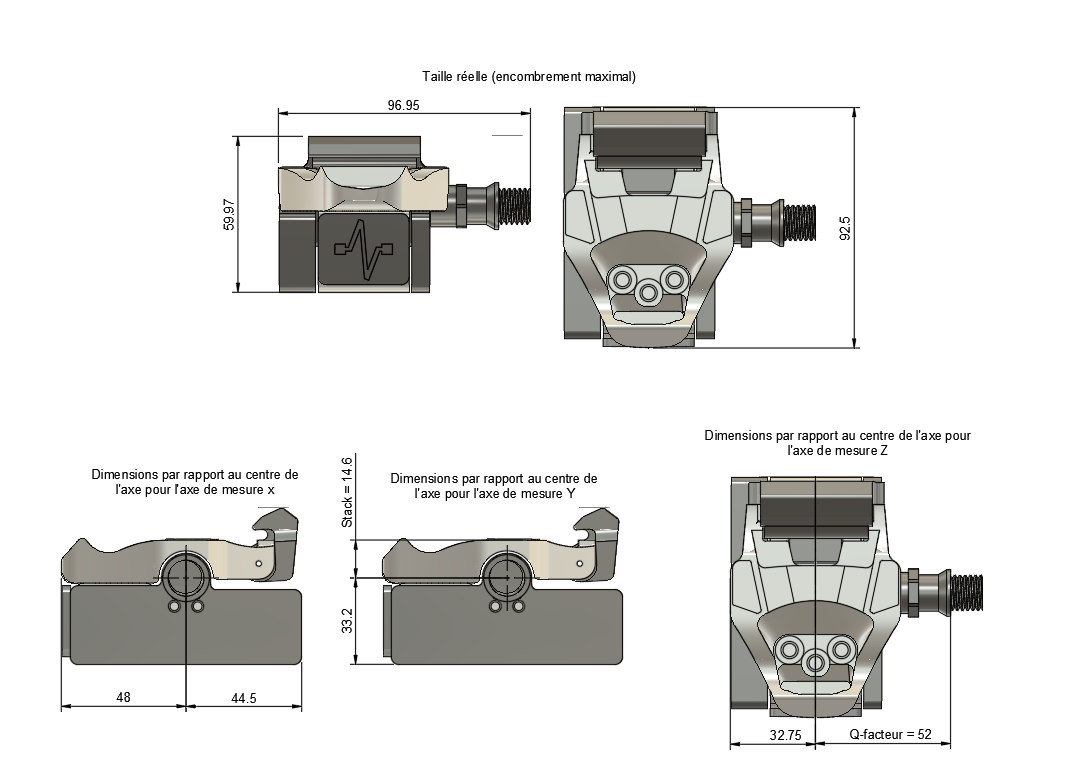
- Q-factor (between the crank and the application point): 52 mm
- Stack (between the axle center and the application point): 14.6 mm (+ cleat height)
- Actual size (for packaging): 92.5 × 97 × 60.8 mm
Dimensions relative to the axle center:
| Axis | Min | Max |
|---|---|---|
| X | -44.5 mm | +48 mm |
| Y | -52 mm | +32.75 mm |
| Z (application point) | -14.6 mm | — |
| Z (top of the assembly) | -27.6 mm | +33.2 mm |
LOOK pedal
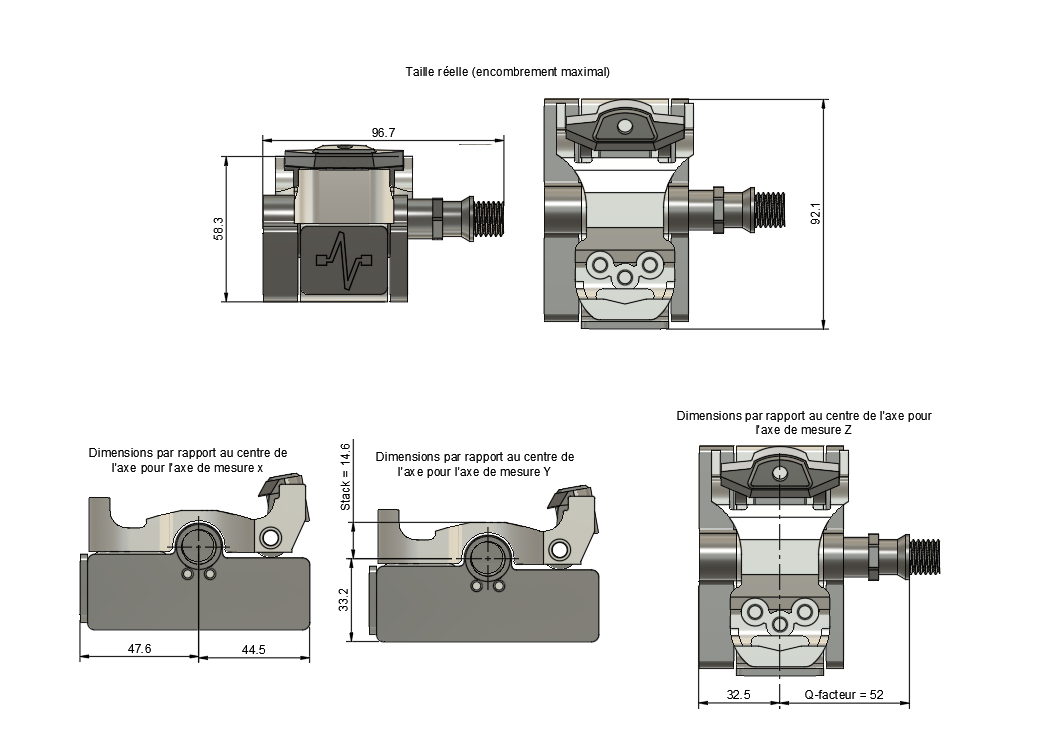
- Q-factor (between the crank and the application point): 52 mm
- Stack (between the axle center and the application point): 14.6 mm (+ cleat height)
- Actual size (for packaging): 92.1 × 97 × 58.3 mm
Dimensions relative to the axle center:
| Axis | Min | Max |
|---|---|---|
| X | -44.5 mm | +47.6 mm |
| Y | -52 mm | +32.5 mm |
| Z (application point) | -14.6 mm | — |
| Z (top of the assembly) | -25 mm | +33.2 mm |
Complete technical documentation
Complete technical documentation (FR)
Technical data sheet (EN)
User guide
I. Mounting the pedals
- Apply grease to the thread of the pedal axle and screw the pedals onto the cranks. Tighten to a torque of 35 to 55 Nm.
- Unplug the pedals before use and check that they do not run into cables or other obstacles along their path.
II. Calibration
The PI3D have two calibration procedures: one for the offsets (i.e. the pedals' no-load values) and the other for the calibration matrix (conversion of force signals into kg). These two procedures are separate.
Offset calibration
Offset calibration can be performed regularly, as this value is sensitive to changes in temperature, load, or even reassembly of the pedals. The procedure is simple and is guided from the Phyling application interface via the calibration module.
Offset calibration procedure from the Phyling application calibration module
The calibration procedure is started from the Phyling application by choosing the "3D pedal tare" calibration. The pedals must be connected to the Maxi-Phyling (see the Bluetooth recording mode section below). The on-screen instructions follow this sequence:
- Once the pedals are mounted on the cranks, place the first pedal and the crank forward, horizontally. Do not touch the pedal for 10 seconds.
- Place the pedal's sensor block horizontally (parallel to the crank) using an accurate spirit level (or equivalent tool). Do not move for 5 seconds.
- Apply the obtained calibration to the pedal's Maxi-Phyling.
- Repeat the operation for the second pedal.
Matrix calibration
The calibration matrix can be updated once a year using calibrated masses. Phyling will support you through this procedure. The PI3D sensor is attached to a calibration bench that allows the sensor to be loaded along each axis by placing masses. For each axis, force steps give the correspondence between the digital signal and the value in kg. This procedure also makes it possible to quantify the cross-axis effects of multi-axis sensors.
III. Data recording
Each PI3D pedal is equipped with a Mini-Phyling V2 acquisition unit that records data locally or transmits it in real time over Bluetooth.
Local recording mode
The PI3D have internal memory, which allows them to record with complete autonomy.
- Press the ON button for half a second to turn on the pedals. The green LED lights up.
- Press the REC button with a quick click to turn on the blue LED, which indicates that data is being recorded. Repeat the operation on each pedal.
- Press the REC button with a quick click to stop recording. The LED turns green again.
- Export the data from each pedal by switching the PI3D's Mini-Phyling to USB mode with a long press on the ON button (Mini-Phyling off). Then connect the power cable to a USB port on the computer. The file is located in the DATA folder.
Pedal synchronization
A basic synchronization system between the two pedals can be added in this recording configuration. To do so, first make a recording of thirty seconds with the PI3D connected to the Maxi-Phyling. This synchronizes the internal clock of the pedals' Mini-Phyling. Avoid turning off the pedals after this operation.
Warning
We do not guarantee synchronization as precise as that obtained with Bluetooth recording.
Bluetooth recording mode
A Bluetooth (BLE) connection is established between each pedal and the Maxi-Phyling. The Maxi-Phyling controls pedal synchronization and data recording. With this recording mode, the synchronization between the Maxi-Phyling and the pedals' Mini-Phyling is under 5 ms.
- Turn on the PI3D and the Maxi-Phyling. The connection is established automatically. The LED of each pedal and the LED of the Maxi-Phyling stop blinking when the pedal/Maxi-Phyling connection is established.
- Press the REC button on the Maxi-Phyling to start recording. The Maxi-Phyling LED turns blue. You can also control recording from the Phyling application interface, in the Real time tab of the Hub.
- Press the REC button again to end the recording.
- The Maxi-Phyling automatically sends its data to the Hub. Otherwise, use USB mode to export the data as described in step 4 of the previous section.
Real-time visualization
When both pedals are connected to the Maxi-Phyling, the application displays the pedaling variables in real time (forces, tangential force, efficiency, total power, cadence, crank angle) as well as summary indicators: power, 3 s average power, cadence, average efficiency and right/left balance. The real-time calculation approaches that of the full analysis while remaining causal (no non-causal filtering).
IV. Data processing
- Associate: In the Data tab, find the recordings associated with an athlete. Unassociated data from a recent recording can be accessed by clicking the NEW button (in blue). Click a recording to associate it.
- Visualize: Click an associated recording to view the data, make selections and export the data in
csvformat.
Data
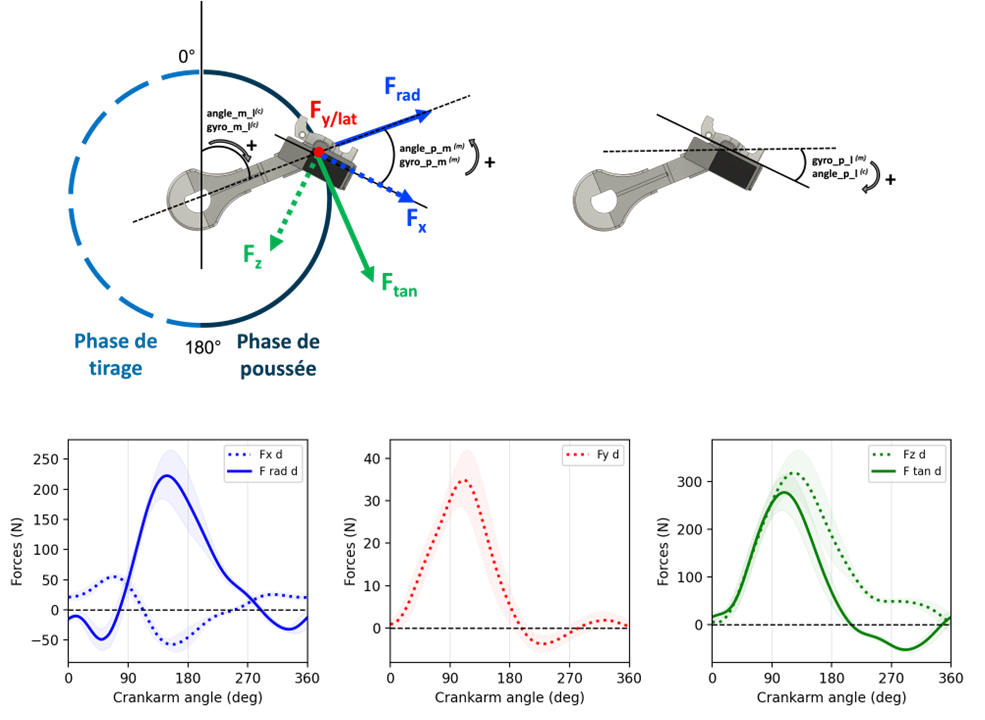
The data recorded and calculated by the Maxi-Phyling provides comprehensive information on pedaling efficiency, the push and pull phases, the forces applied along each axis, and the power developed. To make the most of this data, Phyling makes the raw data from each sensor available. Phyling has also developed specific analyses to calculate certain indicators.
Sampling frequencies
| Sensor | Frequency |
|---|---|
| Forces | 200 Hz |
| Gyroscope | 200 Hz |
| Angular sensor (magnetic) | 200 Hz |
The table below describes the calculated variables and how they were obtained. Variables corresponding to the left (resp. right) pedal have a name ending in _g (resp. _d). In this table, only the descriptions of the left pedal variables are given, along with the descriptions of the variables obtained by combining the 2 pedals.
| Indicator | Description | Unit | Calculation |
|---|---|---|---|
| T | Time | s | |
| T_norm | Time normalized per cycle | cycle | |
| Fx_g | Force x | kg | Raw data |
| Fy_g | Force y | kg | Raw data |
| Fz_g | Force z | kg | Raw data |
| gyro_p_l_g | Angular velocity of the pedal in the lab reference frame | deg/s | Raw data |
| angle_p_m_g | Pedal/crank angle | deg | Raw data |
| gyro_p_m_g | Angular velocity of the pedal/crank | deg/s | Raw data |
| gyro_m_l_g | Angular velocity of the crank/lab | deg/s | By combining gyro_p_l_g and gyro_p_m_g |
| norm_g | Force norm | kg | |
| Fr_g | Radial force | kg | By rotating the forces Fx_g, Fy_g, Fz_g using the angle angle_p_m_g |
| Fl_g | Lateral force | kg | By rotating the forces Fx_g, Fy_g, Fz_g using the angle angle_p_m_g |
| Ft_g | Tangential force | kg | By rotating the forces Fx_g, Fy_g, Fz_g using the angle angle_p_m_g |
| Eff_g | Pedaling efficiency | Ft_g / norm_g | |
| Eff_mean_g | Average efficiency per pedaling cycle | moy(abs(Eff)) | |
| Power_g | Power | W | Ft_g x gyro_m_l_g x long_maniv |
| Power_mean_g | Average power per pedaling cycle | W | moy(Power_g) |
| Power_push_g | Average power during the push phase | W | |
| Power_pull_g | Average power during the pull phase | W | |
| Power | Total power | W | Power_g + Power_d |
| Power_mean | Average total power | W | moy(Power) |
| Balance | Right/left balance (right leg share, 50 % = balanced) | % | moy(Power_d) / (moy(Power_g) + moy(Power_d)) x 100 |
| motif_id | Pedaling cycle number | Pedaling cycle detection from the angle angle_p_m_d | |
| Theta | Right crank angle | deg | By integrating gyro_m_l_d |
| Phase | Pedaling cycle phase (push or pull) | 1 if Theta > 180, 0 otherwise (Phase=1: push on the left, pull on the right; Phase=0: push on the right, pull on the left) | |
| Cadence | Cadence | rpm | Simple conversion of gyro_m_l_g |
| Cadence_mean | Average cadence | rpm | moy(Cadence) |
| timestamp | Timestamp since 1970 | s | From the Maxi-Phyling time |