PhyPlates
PhyPlates
Overview
PhyPlates are small single-axis force platforms specially developed for jump analysis such as the Counter Movement Jump (CMJ).

Technical specifications of a PhyPlate
| Specification | Value |
|---|---|
| Dimensions | 400 x 300 cm |
| Weight | 5.3 kg |
| Sensors | 1 sensor at each corner (measurement along the normal axis) |
| Sampling rate | up to 1kHz |
The validation paper for the PhyPlates platforms is available at the following address: www.phyling.fr/file-share
Scenario workflow
For each scenario described below, the workflow is as follows:
- Set the scenario parameters (number of repetitions, athlete, etc.)
- Tare the PhyPlates sensors
- The athlete gets into position
- Perform the n repetitions
- Data analysis and automatic generation of a PDF report
CMJ Scenario
The Counter Movement Jump (CMJ)
The Counter Movement Jump (CMJ) is an exercise that belongs to the vertical jump category. It is used by strength and conditioning coaches to track athletes' physical level, since several biomechanical indicators make it possible to monitor technical skills. For example, jump height is correlated with muscular strength (Nuzzo et al., 2008) and running speed (Kale et al., 2009); it also helps characterize neuromuscular fatigue (Claudino et al., 2017). In addition, the Reactive Strain Index (RSI) makes it possible to track athletes' explosiveness (Kipp et al., 2016).
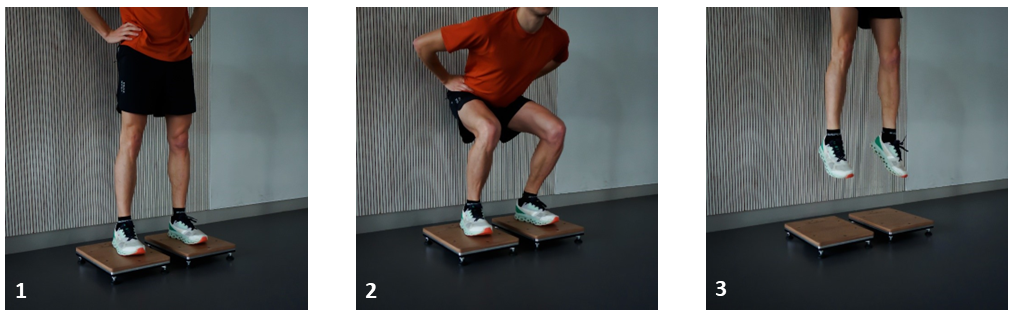
The CMJ is performed as follows:
- Stand upright, legs straight, with hands on hips
- Bend the knees, lowering the pelvis as low as possible
- Push off the ground in one continuous movement (without pausing) and launch into the air
Example report
Interpreting the results
The CMJ can be broken down into three phases: the propulsion phase, the flight phase and the landing phase. Only the propulsion phase determines CMJ performance, since this is when the athlete must develop maximum force to rise as high as possible into the air. Jump height is used to assess CMJ performance. To analyze the performance achieved, the indicators below help to better understand how it was produced.
| Indicator name | Description | Unit | Detailed definition |
|---|---|---|---|
| H | Jump height | cm | Jump height calculated using the Impulse Momentum method (Xu et al., 2022). |
| asymetrie | Asymmetry | % | Impulse ratio between the right leg and the left leg. The goal is to minimize this ratio. |
| P_max | Max power | W/kg | The maximum power generated during the propulsion phase. The higher the power, the better the jump height. |
| rel_imp | Relative impulse | N.s/kg | Amount of force produced during the propulsion phase. Independent of body weight, it allows performances to be compared. |
| RSI | RSI | Jump height divided by the total time needed to perform the jump. Indicates explosiveness. | |
| CRPD | Power rate of development | W/s/kg | Average slope of the power curve over the concentric phase. Higher = better power development. |
| ERFD | Eccentric RFD | N/s/kg | Slope of the force increase during the eccentric phase. Indicates a faster and greater eccentric impulse. |
For a complete analysis, it is worth considering the temporal indicators of the jump. According to McHugh et al. (2021), the optimal profile for CMJ performance is the one where maximum force occurs at the lowest position. Thus, for the best repetition of the set, the moments of maximum force and of the lowest point are identified on the curves. These moments provide a qualitative way to identify biomechanically efficient jumps: the closer these instants are, the more efficient the jump.
Note: The unloading phase is a preparation phase for the jump, preceding the eccentric phase, which corresponds to the jumper's descent. The concentric phase is the phase from the moment of the lowest point to takeoff.
Single-leg CMJ Scenario
Exercise description
The single-leg Counter Movement Jump is a variant of the Counter Movement Jump performed on one leg. This exercise is used by strength and conditioning coaches to track athletes' physical level, since several biomechanical indicators make it possible to monitor the technical and motor skills of each limb in isolation.
The single-leg CMJ is performed as follows:
- Stand upright, leg straight, with hands on hips, free leg bent backward.
- Bend the knee, lowering the pelvis as low as possible.
- Push off the ground in one continuous movement (without pausing) and launch into the air.
Example report
Indicator description
| Indicator name | Description | Unit | Detailed definition |
|---|---|---|---|
| side | Jump side | Leg with which the single-leg jump was performed. | |
| H | Jump height | cm | Jump height calculated using the Impulse Momentum method (Xu et al., 2022). |
| P_max | Max power | W/kg | The maximum power generated during the propulsion phase. The higher the power, the higher the jump height. |
| rel_imp | Relative impulse | N.s/kg | Amount of force produced during the propulsion phase to rise into the air. Allows performances to be compared independently of body weight. |
| RSI | RSI | Jump height divided by the total time needed to perform the jump. Indicates explosiveness and reactivity. | |
| CRPD | Power rate of development | W/s/kg | Average slope of the power curve over the concentric phase. Higher = faster power development. |
| ERFD | Eccentric RFD | N/s/kg | Slope of the force increase during the eccentric phase. Indicates a greater and faster eccentric impulse. |
Hop Test Scenario
Exercise description
The Hop Test (or Repeated CMJ) is a dynamic variant of the vertical jump that consists of chaining several repetitions without pausing. This exercise is favored by strength and conditioning coaches to assess reactive ability (SSC - Stretch-Shortening Cycle) and power endurance. Unlike the single CMJ, this test makes it possible to calculate a fatigue index by observing the decline in jump height and power over the repetitions (FIND A REF/ARTICLE).
The athlete's goal is to maintain maximum height while minimizing ground contact time, which places heavy demands on musculotendinous stiffness.
Execution protocol
The Hop Test is performed as follows:
- Stand upright, legs straight, with hands on hips.
- Bend the knees, lowering the pelvis as low as possible to initiate the first jump.
- Push off the ground in one continuous movement and launch into the air.
- On landing, rebound immediately (without pausing) to chain the following jumps, aiming to maximize height and minimize ground contact.
Example report
Interpreting the results
Hop Test analysis focuses on how performance evolves from jump to jump. Unlike the classic CMJ, where only the peak is analyzed, here consistency and the ability to reproduce force are crucial.
The test highlights neuromuscular fatigue when the indicators (notably height and RSI) drop sharply before the end of the set. The indicators below make it possible to monitor this evolution and the efficiency of the rebound.
Key Hop Test indicators
| Indicator name | Description | Unit | Detailed definition |
|---|---|---|---|
| RSI | Mod. RSI | ratio | Jump height divided by jump time (contact time). Related to jump strategy and reactive abilities. |
| JH | Jump height | cm | Height of the jump after the rebound. |
| raideur | Stiffness | kN/m | Max force during the jump divided by the downward displacement of the center of mass. |
| freq | Frequency | Hz | Jump frequency (or cadence) in Hz, corresponds to the number of jumps per second. |
| F_mean | Mean force | kg | Mean force generated during the jump. |
| F_max | Max force | kg | Maximum force generated during the jump. |
| rfd | RFD | kg | Average rate of force development during the rebound. A high value indicates fast and substantial force application to the ground. |
| asym | Asymmetry | % | Ratio between the max force exerted by the left leg and that of the right leg. |
| len_jump | Rebound duration | ms | Ground contact time (in ms) during the rebound. |
| len_flight | Flight time | ms | Airborne time (in ms) during the jump. |
| com_deplacement | CoM displ. | m | Downward displacement of the center of mass during the jump. |
Qualitative analysis
For a qualitative analysis, it is important to observe the athlete's jump strategy. An athlete who maintains jump height but significantly increases contact times over the repetitions shows signs of fatigue or an inability to use the stretch-shortening cycle effectively (muscular compensation). The evolution of the jump-by-jump RSI is often the most representative curve of the athlete's condition.
Drop Jump Scenario
Exercise description
The Drop Jump (DJ) is an exercise that also belongs to the vertical jump category. Widely used by strength and conditioning coaches, it makes it possible to assess athletes' explosive and elastic qualities through various biomechanical indicators. For example, the Reactive Strength Index (RSI), measured during the DJ, is a reliable tool for assessing muscular reactivity and explosiveness. In addition, ground contact time and jump height are parameters that provide information on how effectively the stretch-shortening cycle is used.
The Drop Jump is performed as follows:
- Step onto a raised surface (box or step).
- Drop off from this height (without jumping) while keeping a neutral posture.
- As soon as the feet touch the ground, perform a quick push-off to reach maximum height, minimizing ground contact time.
Example report
Indicator description
| Indicator name | Description | Unit | Detailed definition |
|---|---|---|---|
| drop_height | Actual drop height | cm | Height from which the athlete dropped. Calculated by double integration from the static phase at the end of the jump. |
| jump_height | Rebound height | cm | Jump height during the rebound off the ground. |
| rsi | RSI | Jump height divided by the total time needed to perform the rebound. Indicates explosiveness and lower-limb reactivity. | |
| rfd | RFD | BW/s | Average rate of force development during the rebound. Higher = fast and substantial force development. |
| pourcent_brake_prop | Braking / propulsion ratio | Ratio between the time spent braking and the time spent propelling vertically during the rebound. | |
| max_force | Max force | kg | Maximum force developed during the whole task. |
| len_jump | Rebound duration | ms | Duration of the rebound on the ground. A duration under 250 ms is required to validate the jump. |
| valide | Trial validity | The jump is valid if the rebound duration is under 250 ms. | |
| brake_dist | Braking distance | cm | Distance traveled by the center of mass during braking. A large distance may indicate a landing that is too "flattened". |
| prop_dist | Propulsion distance | cm | Distance traveled by the center of mass during propulsion. |
| brake_time | Braking phase duration | ms | Time needed for the center of mass to go down after impact. |
| prop_time | Propulsion phase duration | ms | Time needed for the center of mass to rise again after braking. |
| asymetrie_max_force | Max force asymmetry | Ratio between the maximum force of the left leg and of the right leg. | |
| asymetrie_rfd | RFD asymmetry | Ratio between the RFD of the left leg and that of the right leg. | |
| asymetrie_len | Contact time asymmetry | Ratio between the contact time of the left leg and that of the right leg. |
Squat Jump Scenario
Exercise description
The Squat Jump (SJ) is an exercise belonging to the vertical jump category. It is widely used by strength and conditioning coaches to assess athletes' explosive strength qualities, by isolating the concentric component of the movement. For example, the jump height measured during an SJ is a direct indicator of the force developed without any contribution from the stretch-shortening cycle. This exercise also makes it possible to track the evolution of muscular power and to assess neuromuscular fatigue.
The Squat Jump is performed as follows:
- Stand upright, feet hip-width apart, hands on hips to avoid arm swing.
- Bend the knees until the thighs are parallel to the ground and hold this position motionless.
- Perform an explosive push-off from this static position, launching vertically to reach maximum height.
Example report
Indicator description
| Indicator name | Description | Unit | Detailed definition |
|---|---|---|---|
| H | Jump height | cm | Jump height calculated using the Impulse Momentum method (Xu et al., 2022). |
| asymetrie | Asymmetry | % | Impulse ratio between the right leg and the left leg. The goal is to minimize this ratio for an efficient jump. |
| P_max | Max power | W/kg | Maximum power generated during the propulsion phase. The higher it is, the greater the jump height. |
| rel_imp | Relative impulse | N.s/kg | Amount of force produced during the propulsion phase. Allows performances to be compared independently of the athlete's body weight. |
| RSI | RSI | Jump height divided by the total time needed to perform the jump. Indicator of lower-limb explosiveness and reactivity. | |
| RFD | Concentric RFD | N/s/kg | Maximum rate of force development during the concentric phase. A high RFD indicates force developed quickly during the jump. |
| tRFDpeak | Max RFD time | % | Moment at which the maximum RFD occurs, expressed as a percentage of the total jump duration. |
| Valid | Trial validity | The jump is considered valid if the athlete performed no countermovement before jumping. |
Technical notes
- RSI and RFD are key indicators for assessing the explosive quality of the vertical jump.
- Validity (Valid) ensures that the athlete followed the strict test instructions without a countermovement.
Isometric Scenario
Exercise description
The isometric assessment of the lower and upper limbs is a search for maximal voluntary contraction. These exercises are used by strength and conditioning coaches to assess the maximum strength of a muscle group at a given joint angle.
Example report
Indicator description
| Indicator name | Description | Unit | Detailed definition |
|---|---|---|---|
| Ftotmean | Mean total force | kg | Mean of the total force developed during the repetition. |
| Fgmean | Mean left force | kg | Mean of the force developed by the left limb during the repetition. |
| Fdmean | Mean right force | kg | Mean of the force developed by the right limb during the repetition. |
| Ftotmax | Max total force | kg | Maximum force developed during the repetition. |
| Fgmax | Max left force | kg | Maximum force developed by the left limb during the repetition. |
| Fdmax | Max right force | kg | Maximum force developed by the right limb during the repetition. |
| ttomax | Time to reach Fmax | s | Time elapsed between the start of the repetition and the moment Fmax was reached. |
| asymetrie | Asymmetry | % | Ratio between the mean force developed by the left limb and the mean force developed by the right limb. |
| RFDmax | Max RFD | kg/s | Maximum rate of force development during the repetition. Higher = force developed quickly and substantially. |
Technical notes
- Asymmetry indicators (e.g. asymetrie) are useful for identifying possible imbalances between the two sides of the body.
- The time to reach maximum force (ttomax) and the maximum RFD (RFDmax) make it possible to assess the athlete's ability to generate force quickly.
Bibliography
- Claudino, J. G., Cronin, J., Mezêncio, B., McMaster, D. T., McGuigan, M., Tricoli, V., Amadio, A. C., & Serrão, J. C. (2017). The countermovement jump to monitor neuromuscular status: A meta-analysis. In Journal of Science and Medicine in Sport (Vol. 20, Issue 4, pp. 397–402). Elsevier Ltd. https://doi.org/10.1016/j.jsams.2016.08.011
- Kale, M., Asci, A., & Acikada, C. (2009). Relationships among jumping performances and sprint parameters during maximum speed phase in sprinters. Journal of Strength and Conditioning Research, 23(8), 2272–2279. www.nsca-jscr.org
- Kipp, K., Kiely, M. T., & Geiser, C. F. (2016). Reactive strain index modified is a valid measure of explosiveness in collegiate female volleyball players. Journal of Strength and Conditioning Research, 30(5), 1341–1347. https://doi.org/10.1519/JSC.0000000000001226
- McHugh, M. P., Hickok, M., Cohen, J. A., Virgile, A., & Connolly, D. A. J. (2021). Is there a biomechanically efficient vertical ground reaction force profile for countermovement jumps? Translational Sports Medicine, 4(1), 138–146. https://doi.org/10.1002/tsm2.200
- Nuzzo, J. L., Mcbride, J. M., Cormie, P., & Mccaulley, G. O. (2008). Relationship between countermovement jump performance and multijoint isometric and dynamic tests of strength. Journal of Strength and Conditioning Research, 22(3), 699–707. www.nsca-jscr.org