Maxi-Phyling Kayak
Maxi-Phyling Kayak
The Maxi-Phyling is the versatile GPS unit for collecting data in canoe-kayak. Validated by the International Canoe Federation (ICF), it can be used in training as well as in competition. It provides complete feedback on a crew's performance.
The Phyling Kayak app was developed in collaboration with the FFCK (French Canoe-Kayak Federation) and the French Olympic team, and offers a precise analysis of performance indicators specific to sprint kayak and canoe. It gives coaches training feedback through an advanced analysis module to view, compare and process data. The app can also export data as a report or share it directly on training tracking platforms such as Nolio.
Quick start
Setting up the unit on the boat
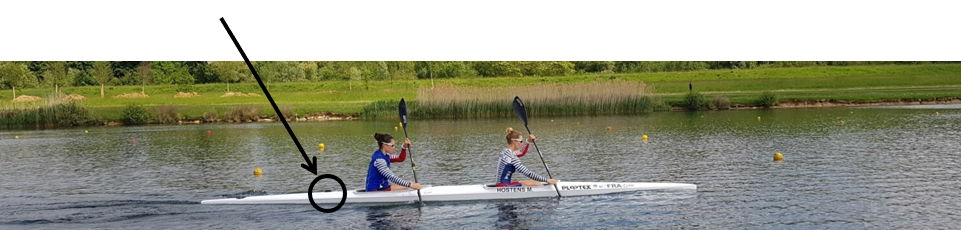
- Firmly attach the Maxi-Phyling to the hull of the boat using a 3M-type Velcro strip
- Make sure the Maxi-Phyling is placed in the direction of travel of the boat
Tip
The Maxi-Phyling can be placed in a waterproof box (such as a food container) to protect it from the elements.
Starting and stopping a recording
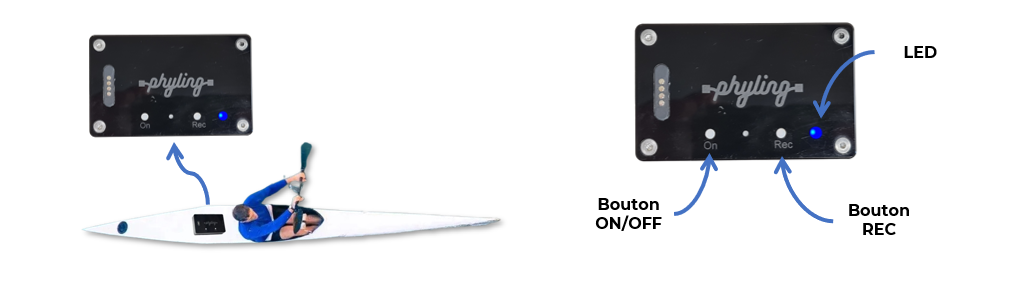
- Turn on the Maxi-Phyling with the ON button (green LED).
- Press the REC button to start recording (blue LED).
- Press the REC button again to end the recording (green LED).
- The data is saved in the Maxi-Phyling and uploaded to the app via USB or Wi-Fi.
Hub and real-time visualization
- Turn on the Hub; it connects automatically to the Maxi-Phyling.
- Access the app through the Hub's Wi-Fi connection. On a PC, tablet or smartphone, enter the address http://192.168.1.42 in your browser.
- Log in with your username and password.
- Real-time data visualization is available in the Real time tab.
Data processing and export
- Find your recordings in the Data tab ("New data" button) to associate them.
- In the Associated data menu, view a recording, create selections and compare several recordings.
- Export your recordings and comparisons in various formats: PDF report, raw data, CSV format.
Data
The data recorded and calculated by the Maxi-Phyling kayak provides comprehensive information on the paddling cycle, speed and stability of the boat. To let you make the most of this data, Phyling makes the raw data from each sensor available. Phyling has also developed specific analyses to calculate certain indicators.
Sampling rates
| Sensor | Frequency |
|---|---|
| IMU | 100Hz |
| GPS | 10Hz |
The tables below describe the variables and indicators calculated, as well as how they were obtained.
CSV file data
This data is included in the CSV file that can be downloaded from the app. It consists of time series sampled at 100Hz, including both raw and calculated data. This is also the data displayed as graphs in the app.
| Variable | Description | Unit | Calculation |
|---|---|---|---|
| T | Time since the start of the recording | s | |
| gyro_x | Angular velocity around the x axis (boat axis) | deg/s | High-pass filter (fc=0.2Hz, order=5) |
| gyro_y | Angular velocity around the y axis (lateral axis) | deg/s | High-pass filter (fc=0.2Hz, order=5) |
| gyro_z | Angular velocity around the z axis (vertical axis) | deg/s | High-pass filter (fc=0.2Hz, order=5) |
| acc_x | Acceleration along the x axis (boat axis) | m/s² | Raw data |
| acc_y | Acceleration along the y axis (lateral axis) | m/s² | Raw data |
| acc_z | Acceleration along the z axis (vertical axis) | m/s² | Raw data |
| roll | Roll | deg | Obtained by integrating the gyro data (positive when the boat tips to the left and negative when it tips to the right) |
| pitch | Pitch | deg | Obtained by integrating the gyro data (positive when the bow of the boat rises and negative when the stern rises) |
| yaw | Yaw | deg | Obtained by integrating the gyro data (positive when the boat turns to port / left and negative when it turns to starboard / right) |
| acc_z_ | Acceleration along the z axis without gravity | m/s² | acc_z - g |
| gpstimeUs | GPS timestamp in microseconds since 1970 | microsecond | Raw data |
| gpsTimeAccuracyNs | GPS time accuracy | nanosecond | Raw data |
| longitude | Longitude | deg | Raw data |
| latitude | Latitude | deg | Raw data |
| speed_gps | Speed | km/h | Raw data |
| altitude | Altitude | m | Raw data |
| heading | Heading | deg | Raw data |
| nSat | Number of satellites | Raw data | |
| PDOP | Position (3D) dilution of precision | Raw data | |
| D | Distance traveled | m | Calculated using the Vincenty method |
| speed | Filtered speed | km/h | Obtained from the GPS coordinates (latitude, longitude). Low-pass filter (fc=0.5Hz, order=2) |
| speed_i | Instantaneous speed | km/h | Fusion algorithm combining the GPS speed speed and the acceleration acc_x |
| motif_id | Unique identifier for each stroke | Stroke detection based on the acceleration signal acc_x | |
| cadence | Stroke rate in strokes/min | spm | From the duration of each paddle stroke |
| pic_acc | Acceleration peak | m/s² | max(acc_x) for each paddle stroke |
| pic_down | Deceleration peak | m/s² | min(acc_x) for each paddle stroke |
| t_acc | Duration of the acceleration phase | s | T[acc_x > 0] for each paddle stroke |
| t_down | Duration of the deceleration phase | s | T[acc_x < 0] for each paddle stroke |
| amp_roll | Roll amplitude | deg | max(roll) - min(roll) for each paddle stroke |
| amp_pitch | Pitch amplitude | deg | max(pitch) - min(pitch) for each paddle stroke |
| d_stroke | Distance per stroke | m | Calculated from speed and stroke rate |
| timestamp | Timestamp since 1970 | s | With GPS, a simple conversion of gpsTimeUs; otherwise the Maxi-Phyling time is used |
Indicators
Indicators are statistics that characterize an entire selection. In the app, they appear in the "Indicators" table and also on the first page of the PDF reports.
| Variable | Description | Unit | Calculation |
|---|---|---|---|
| D_tot | Total distance | m | D[-1] - D[0] over the selection |
| T_tot | Time | T[-1] - T[0] unless a stopwatch time is provided by the user | |
| v_moy | Average speed | km/h | D_tot/T_tot |
| v_max | Maximum speed | km/h | max(v) |
| loss | Loss index characterizing the loss of speed after reaching v_max | % | Area ratio from v_max:100 * (1 - integral(v[imax:], x=T[imax:]) / (v_max * (T[-1] - T[imax]))) |
| cad_moy | Average stroke rate | spm | moy(cadence) |
| cad_max | Max stroke rate | spm | max(cadence) |
| d_stroke | Average distance per stroke | m | From v_moy and cad_moy |
| n_vmax | Number of strokes to reach v_max | ||
| t_vmax | Time to reach v_max | s | |
| d_vmax | Distance to reach v_max | m | |
| t_95vmax | Time spent above 95% of v_max | s | |
| d_95vmax | Distance traveled above 95% of v_max | m |
PDF report
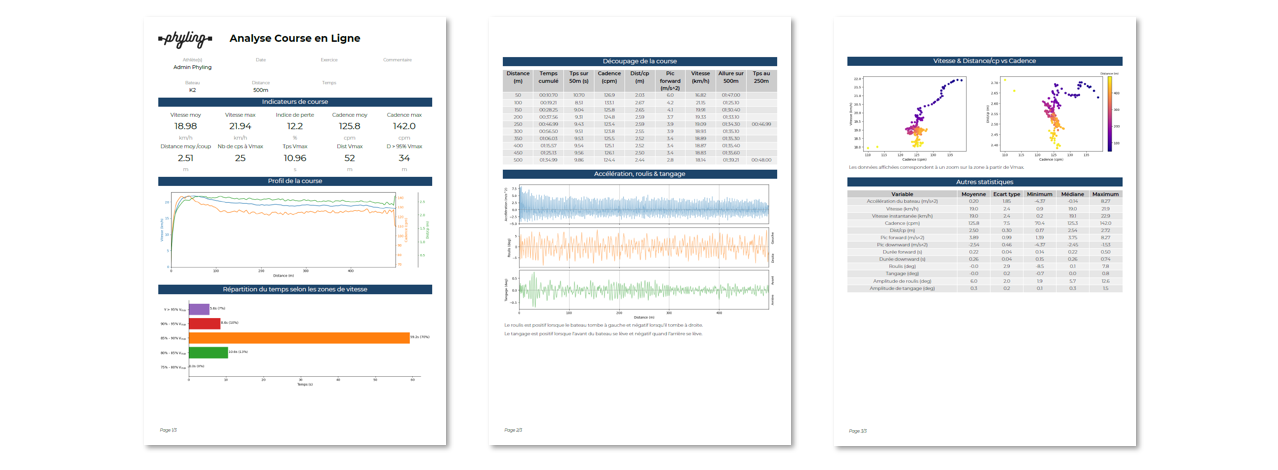
The post-race PDF report for canoe-kayak gives coaches a wealth of information to analyze the performance of their boats in training or in competition. It provides indicators as values and graphs, including the stroke rate-speed profile over the whole race, a detailed breakdown of the time spent in the different speed zones, and a division of the race into segments.
Explanations
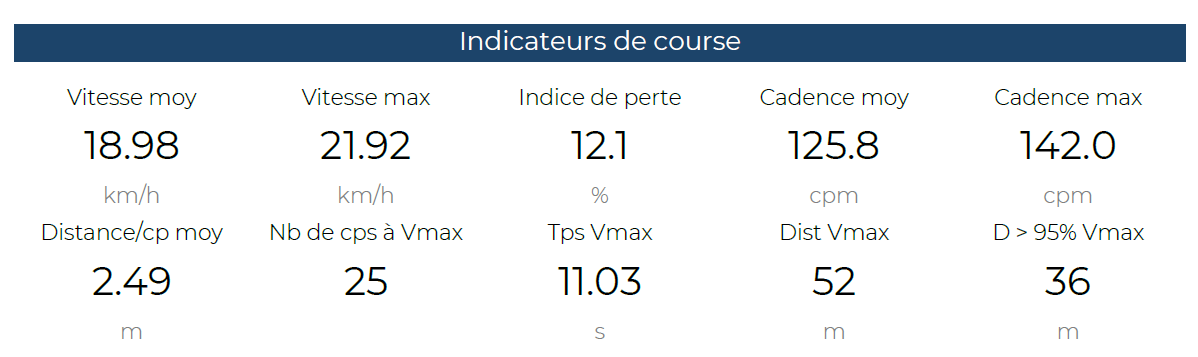
The Race indicators section provides the key indicators for the chosen selection (here a 500m race, but it can also be an exercise during a training session). The indicators are detailed here.
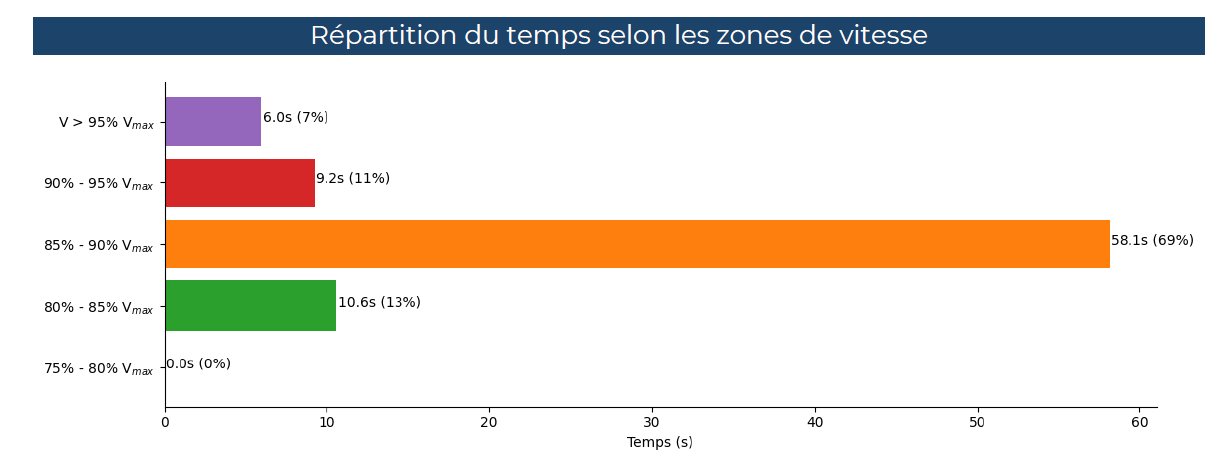
This chart shows the distribution of time spent in the different speed zones (defined from the maximum speed). The goal is to spend as much time as possible in the speed zones close to the maximum speed.
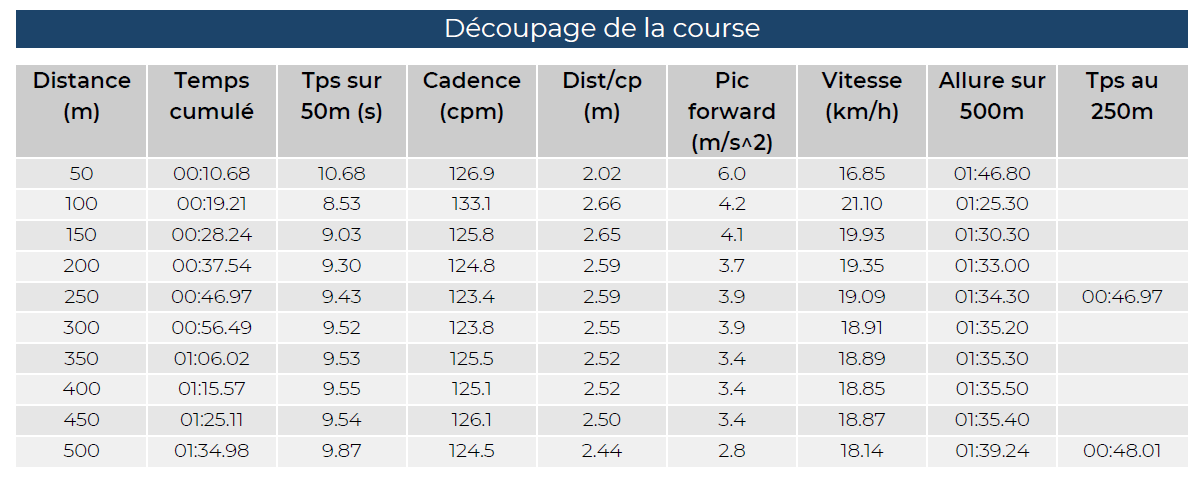
The race is divided into segments (here 50m each) and the Race split table gives the average values of the indicators over each segment of the race.
Note
You can choose the split distance you prefer in the app.
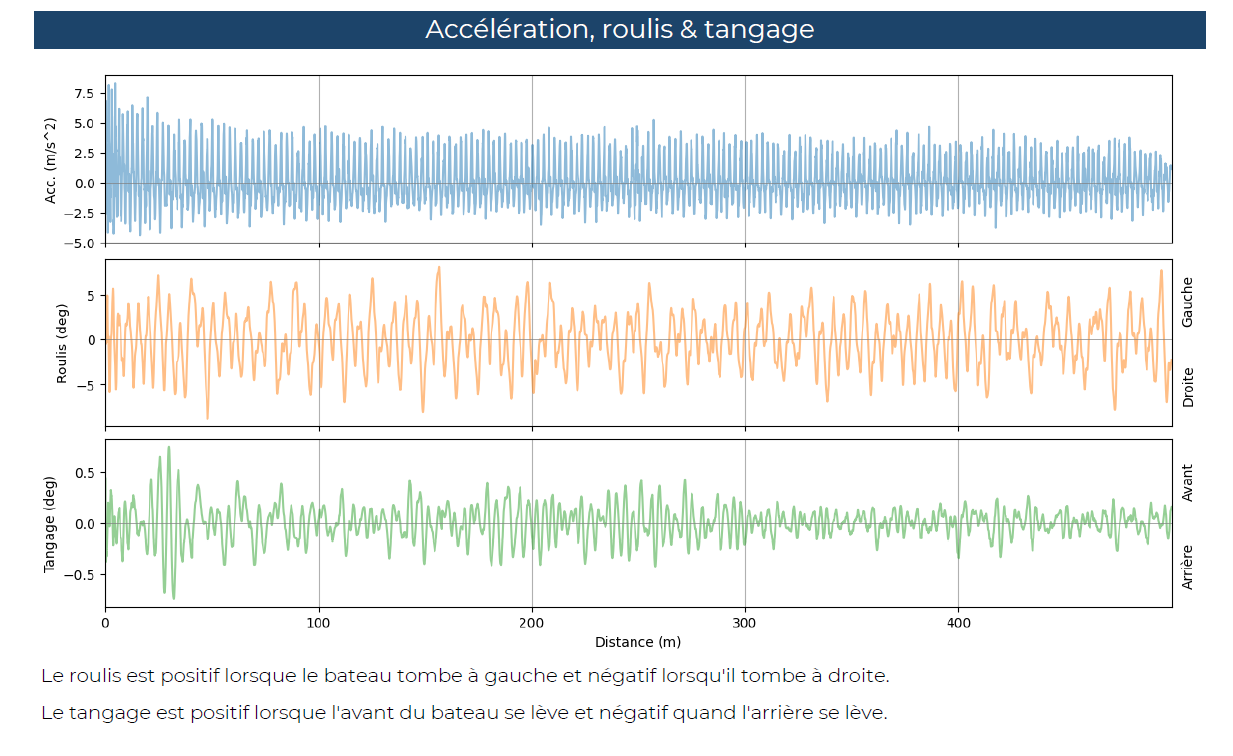
The boat angles (roll and pitch) are shown alongside the boat's acceleration signal. The more stable the boat (small variations in roll and pitch), the lower the friction on the hull.
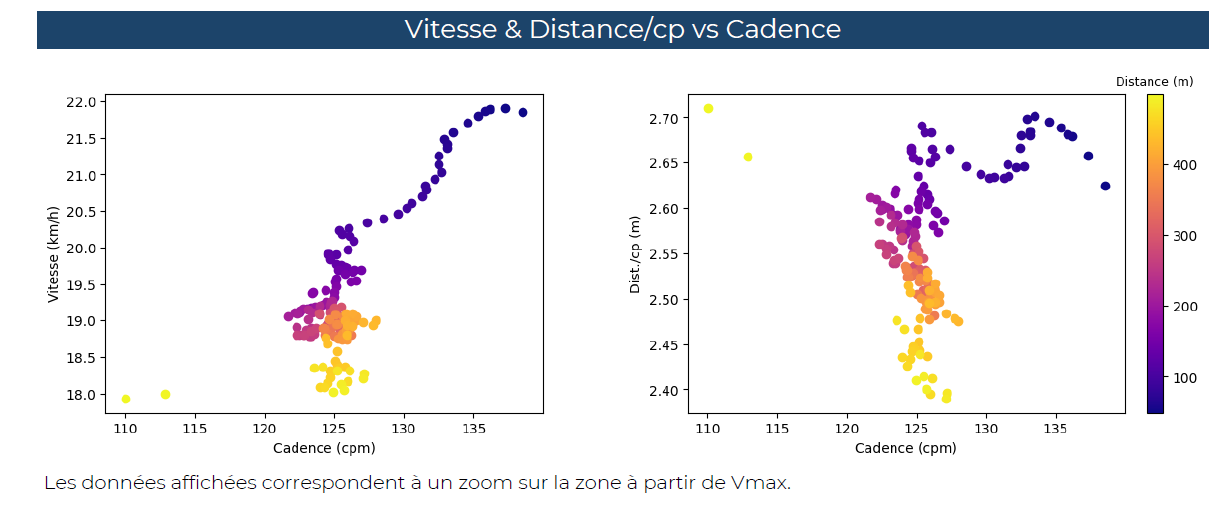
This graph shows the evolution of the Speed vs Stroke rate and Distance per stroke vs Stroke rate relationships from the moment the maximum speed was reached.
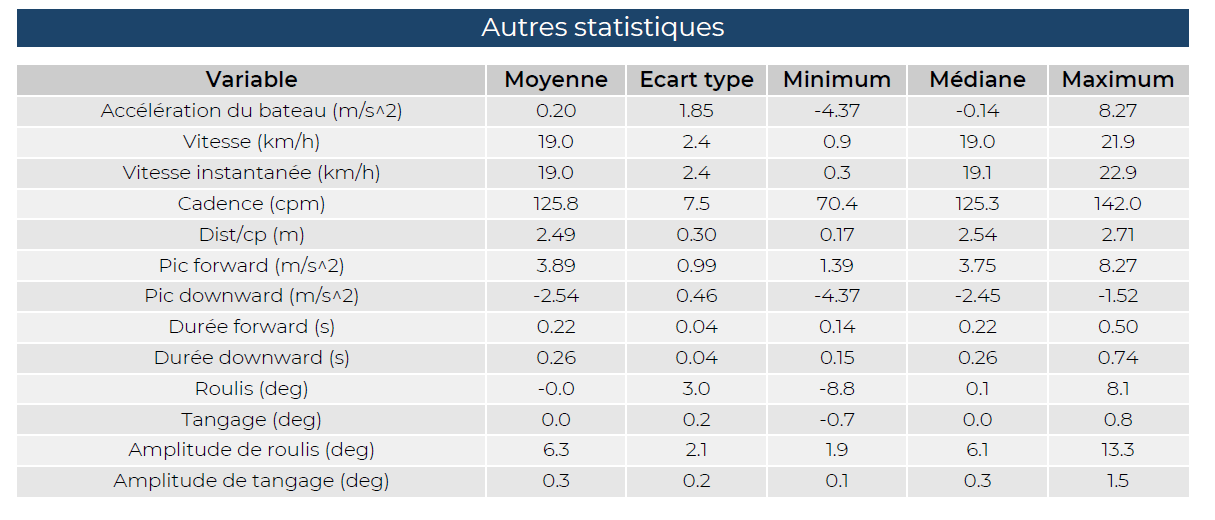
This table presents the detailed statistics (mean, standard deviation, minimum, median and maximum) of each variable over the whole chosen selection.